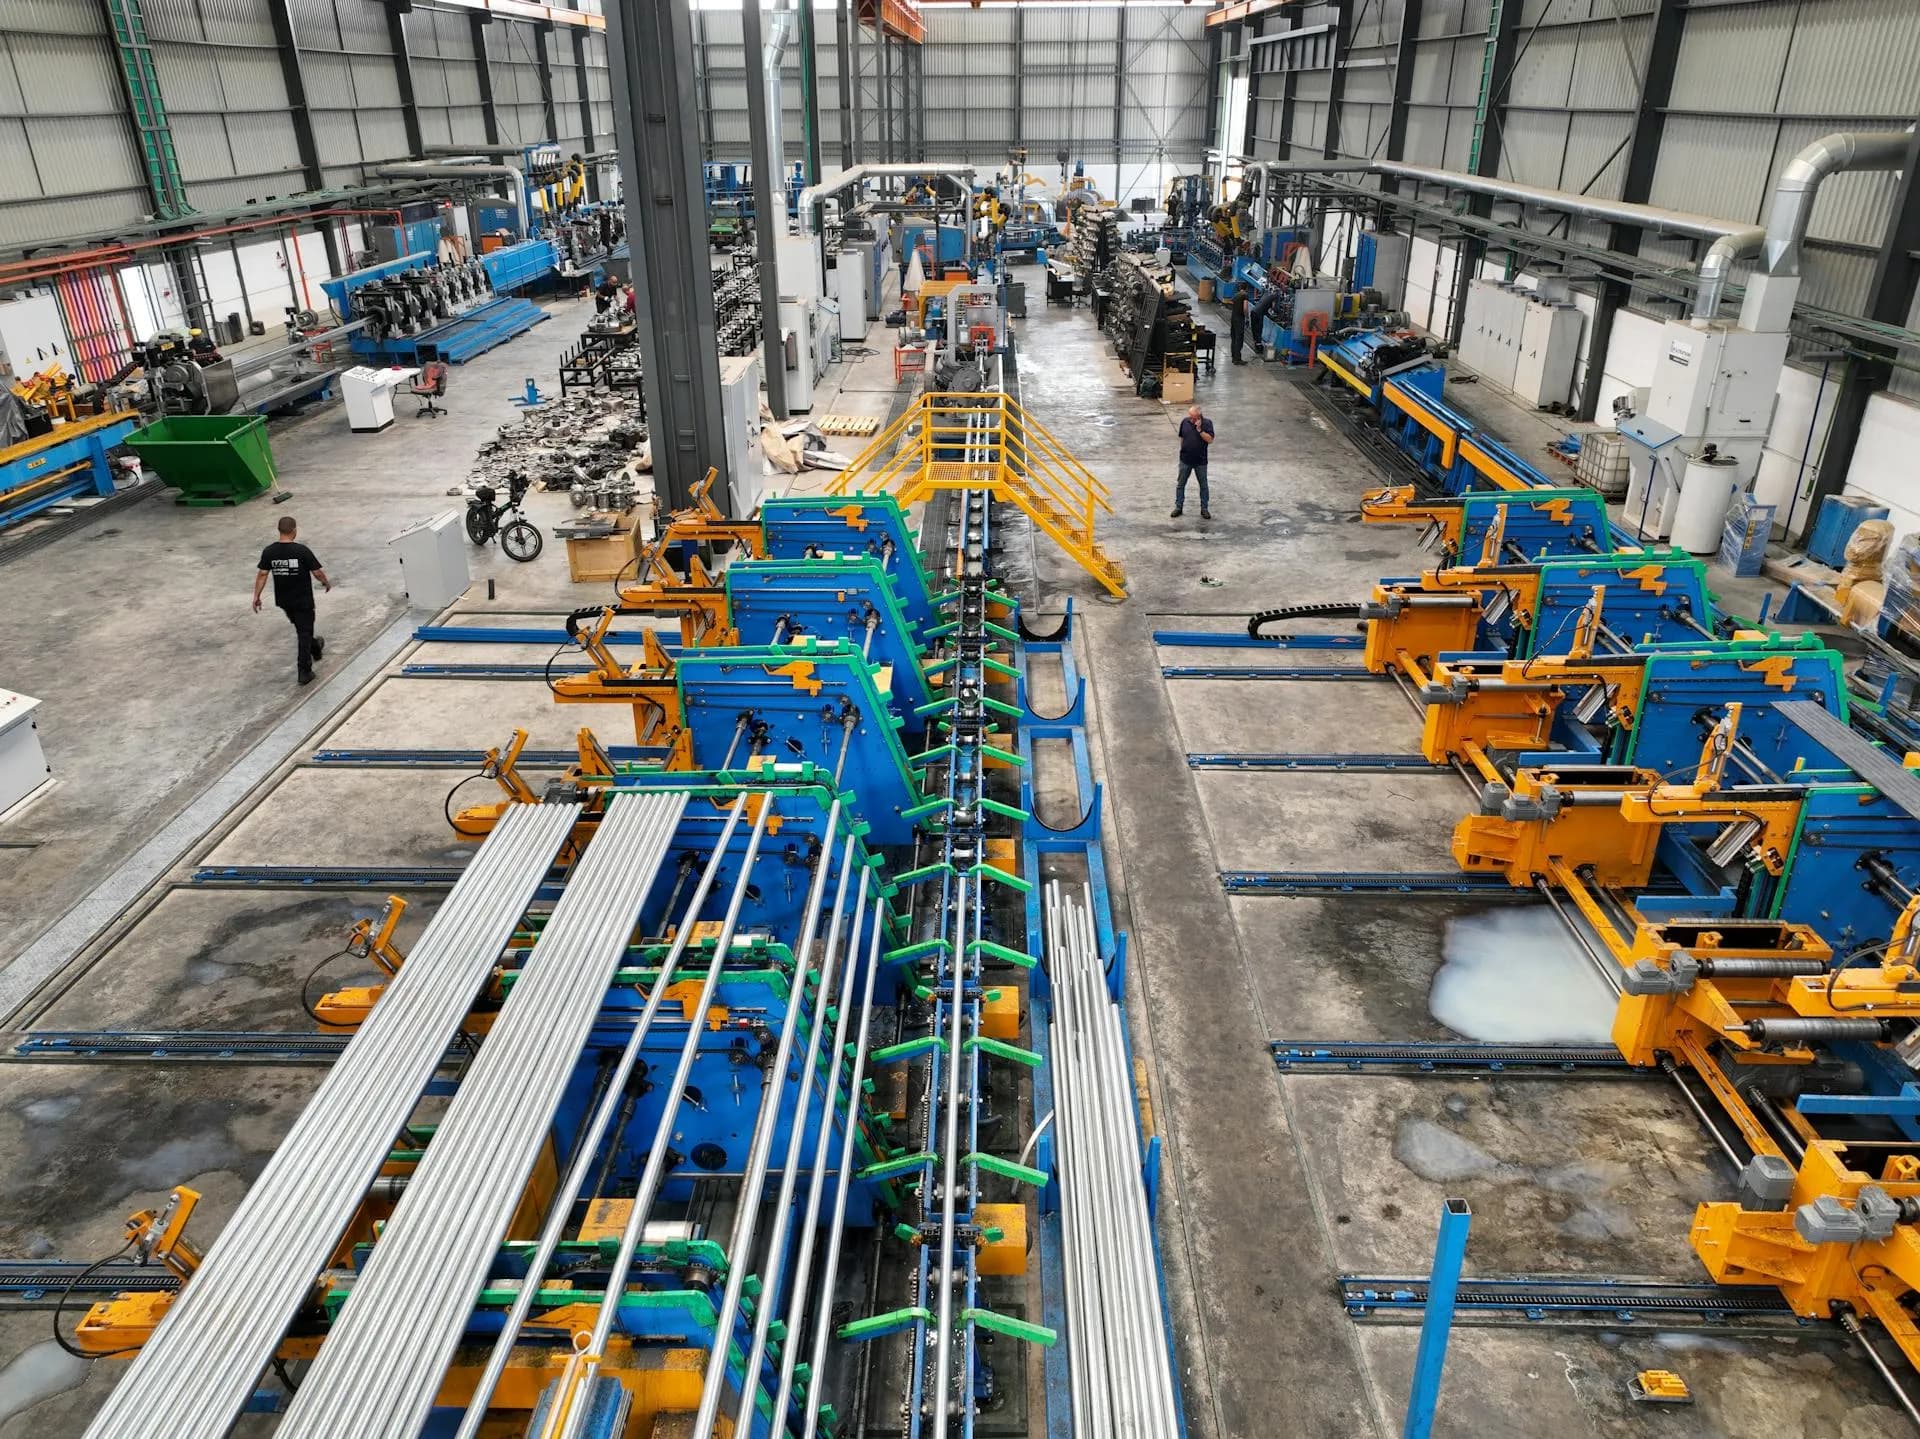
Manufacturing Industry
Productivity down for a decade. 61% of trades roles unfilled. And your competitors are automating while you’re still running spreadsheets.
Australian manufacturing is being squeezed from every direction — rising costs, shrinking margins, a workforce that’s retiring faster than you can replace it, and global competitors who’ve already gone digital. We help you fix the operating systems on your shop floor so you can actually compete.
2.6%
Manufacturing output contracted in 2024
Ai Group
61%
Recruitment difficulty for trades roles
Jobs & Skills Australia
34%
Of efficiency losses from unplanned downtime
L2L
47%
Of manufacturers still facing supply chain disruption
NTI
Sound familiar?
If you’re running a manufacturing operation in Australia right now, you’re probably nodding at most of these.
Your output per person is lower than it was five years ago — but your wages bill is 20% higher
Your best machinist is 58, and the apprentice you hired last year already quit
Unplanned breakdowns eat your production schedule every week, and you find out when the line stops
Your ERP doesn’t talk to the shop floor, your quality records are in a different system, and inventory is a guess
Material costs changed three times this quarter and your quotes are already wrong
Mandatory climate reporting is coming and you’ve got no idea what your Scope 3 emissions look like
You know you need to digitise but you’re stuck with legacy machines, no IT team, and can’t justify the cost
WHS audits, quality standards, Modern Slavery reporting, environmental compliance — the paperwork never stops
It’s not the machines. It’s how the operation runs around them.
Most manufacturers have invested in equipment. But the systems connecting everything — how orders flow to the floor, how quality gets tracked, how maintenance gets scheduled, how data moves between machines, people, and the office — are held together with spreadsheets, whiteboards, and tribal knowledge. When your ERP, quality system, maintenance records, and production data live in different worlds, you’re making decisions on partial information. The technology to fix this is more accessible than ever. But most digital transformations in manufacturing fail because nobody changes how the operation actually works around the new tools. That’s the gap we close.
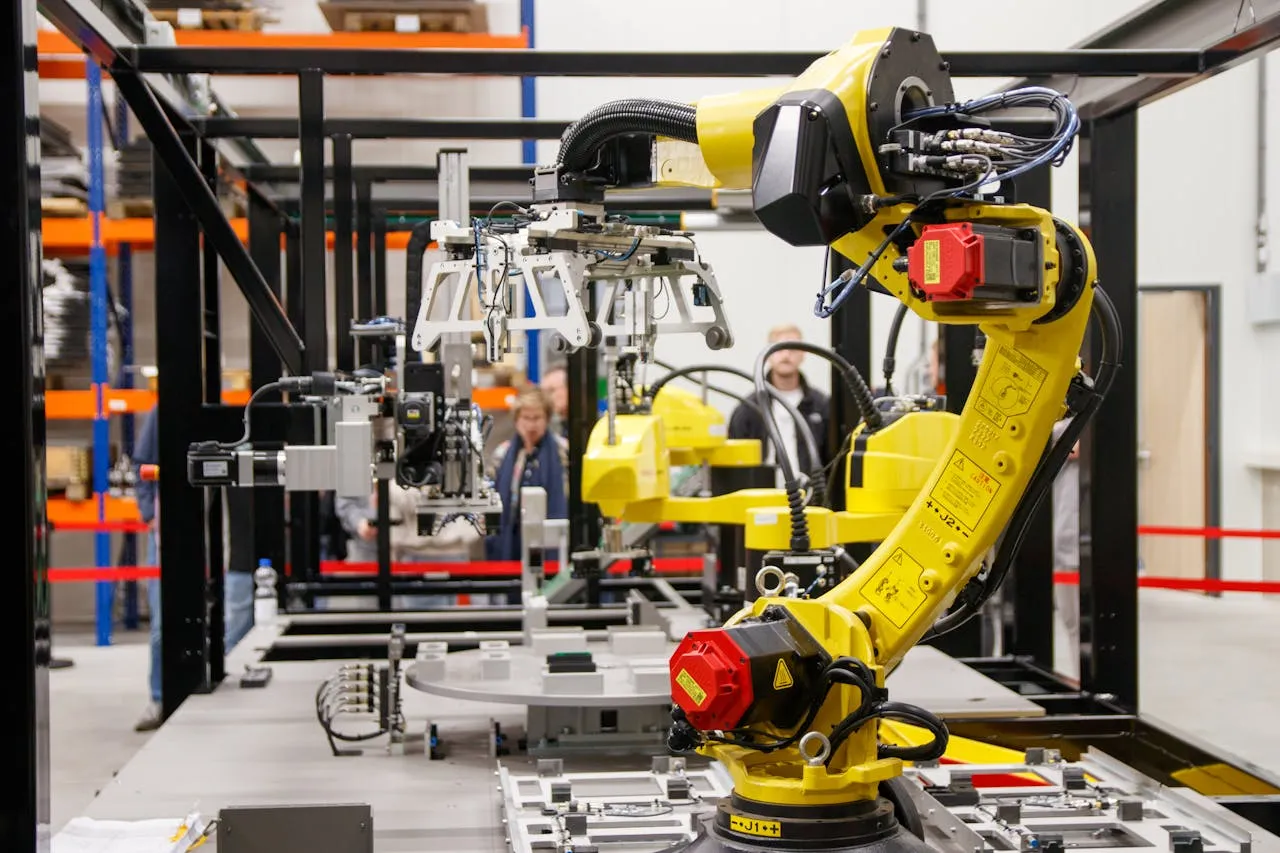
Get more out of every machine, every shift, every person
Get more out of every machine, every shift, every person
Australian manufacturing productivity has fallen over the past decade while wages have risen 5.7% in the last year alone. Unplanned downtime accounts for 34% of efficiency losses and costs $5,000–$50,000 per hour. The gap between what your equipment could produce and what it actually does is where the margin is hiding.
Downtime you don’t see coming
Unplanned breakdowns account for 34% of all efficiency losses. Every unexpected stop cascades through the schedule, creates overtime, and pushes deliveries late. Predictive maintenance reduces unplanned downtime by 30–50%.
No real-time view of the floor
Without OEE tracking, you don’t know your true availability, performance, or quality rates until the end of the shift — or the end of the month. By then, the losses have already happened.
Changeover time eating your capacity
Setup and changeover accounts for 29% of efficiency losses. For short-run manufacturers, this can be the difference between profit and loss on a job. Structured changeover programs cut this by 30–50%.
Equipment effectiveness · Before
You don’t know your real OEE. Production targets are based on gut feel. You find out about problems when the line stops.
Equipment effectiveness · After
Real-time OEE tracking across every machine. You see availability, performance, and quality in real time and can act before small losses become big ones. Typical gains: 10–25%.
Maintenance · Before
You fix things when they break. Critical equipment goes down mid-run. Spares arrive too late or sit on shelves costing money.
Maintenance · After
Condition monitoring and predictive analytics flag problems before they become failures. Maintenance shifts from reactive to planned. Downtime drops 30–50%.
Changeover · Before
Changeovers take as long as they take. There’s no standard process, and each shift does it differently.
Changeover · After
Structured SMED methodology with documented procedures. Changeover times drop 30–50%, freeing capacity you didn’t know you had.

Stop rework from eating your margin
Stop rework from eating your margin
Rework costs up to 25% of production costs across many manufacturing sectors. Companies with proper corrective action processes see 37% less downtime, 28% higher customer satisfaction, and 19% lower material costs. If your quality system is still paper-based, you’re finding problems too late and fixing the same ones over and over.
Finding defects at the end of the line
Without in-process quality checks and real-time SPC, defects travel through the entire production process before being caught. Every station that adds value to a defective part is waste.
Quality records nobody can find
Paper-based quality logs, disconnected inspection records, and no traceability. When a customer complaint comes in or an auditor arrives, you’re scrambling to reconstruct what happened.
Same problems, different day
Without a structured corrective action system, you fix symptoms rather than root causes. The same defects recur, costing you in rework, scrap, customer returns, and reputation.
Defect detection · Before
Defects are caught at final inspection or — worse — by the customer. Rework is a constant drag on margin.
Defect detection · After
In-process checks and real-time quality monitoring catch problems at the source. Scrap and rework drop. Customer complaints fall.
Quality system · Before
Quality records are paper-based, scattered, and take days to compile for audits. Traceability is manual and incomplete.
Quality system · After
Digital quality management with full traceability, automated non-conformance tracking, and audit-ready reports generated in minutes.
Continuous improvement · Before
You know which problems recur but don’t have the data or system to drive root cause analysis and sustained fixes.
Continuous improvement · After
Structured CAPA processes backed by data. Every defect generates a corrective action with follow-up. Problems get solved permanently, not patched.
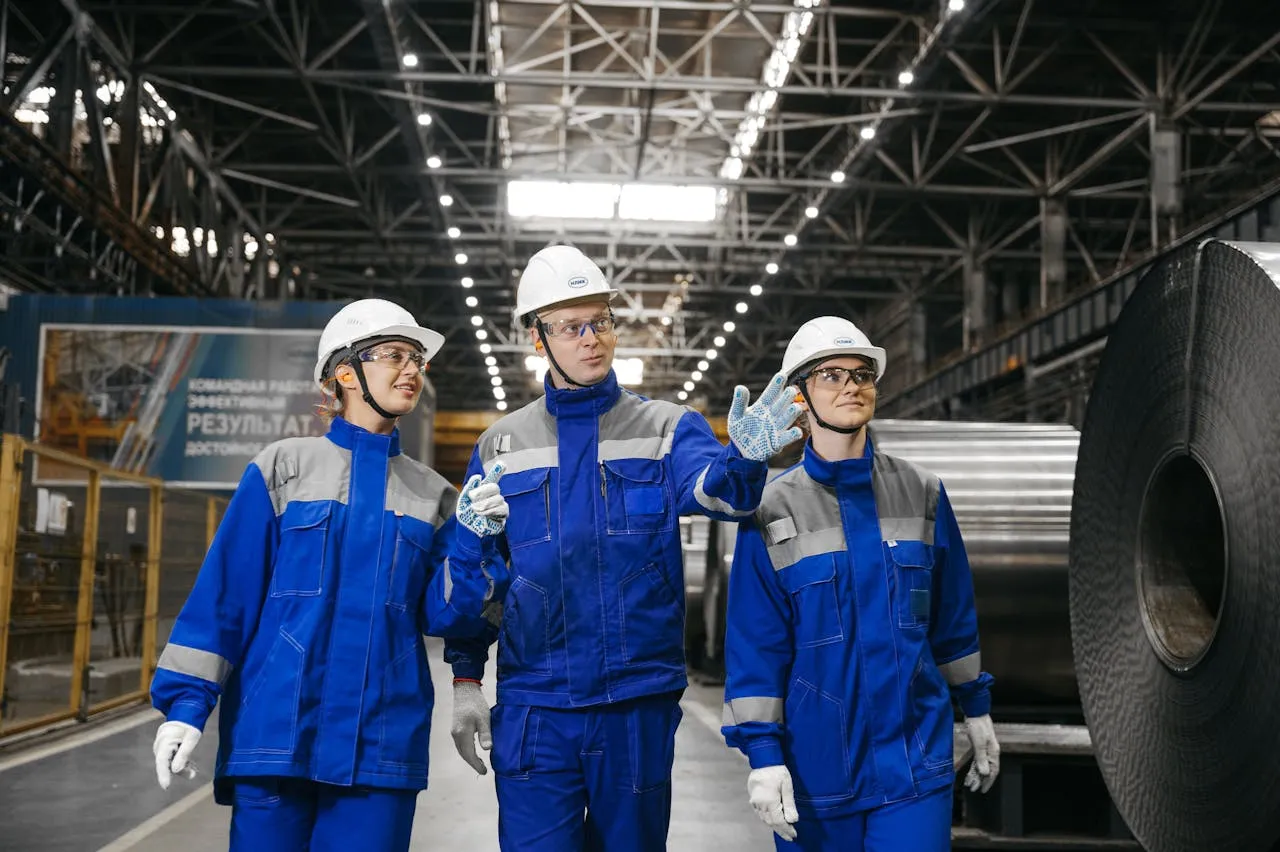
Get more from the people you’ve got
Get more from the people you’ve got — because you can’t find more
61% recruitment difficulty for trades. A projected shortfall of 70,000 welders by 2030. Apprenticeship completion rates at just 43%. The manufacturers that win will be the ones that get more from every operator, every supervisor, and every shift — through better systems, clearer processes, and less time wasted on things that don’t add value.
Knowledge retiring with every departure
Your most experienced operators and tool-setters know things that aren’t written down anywhere — the quirks of Machine 3, the trick to getting the finish right, the supplier that always delivers late. When they leave, that knowledge goes with them.
Operators doing admin, not making parts
Manual data entry, paper-based logs, handwritten job cards, and chasing information from the office. Your highest-skilled people are spending hours a day on work that adds no value.
New starters take too long to be productive
Training is ad-hoc and depends on who’s available to show new people the ropes. With 43% of apprentices not completing, every month of slow onboarding is a risk you can’t afford.
Knowledge capture · Before
Critical process knowledge lives in the heads of your most experienced people. When they retire, you lose decades of know-how.
Knowledge capture · After
Digital work instructions, standardised SOPs, and documented setup procedures. The knowledge lives in the system, not just in people’s heads.
Operator productivity · Before
Operators spend 20–30% of their day on paperwork, data entry, and chasing information. Actual production time is lower than it should be.
Operator productivity · After
Digital job cards, barcode scanning, and real-time production data entry at the machine. Operators focus on making parts, not filling in forms.
Workforce development · Before
Training is informal and inconsistent. Skills gaps are discovered when something goes wrong, not before.
Workforce development · After
Skills matrices, structured competency frameworks, and digital training records. You know exactly who can do what, and you can prove it to auditors.
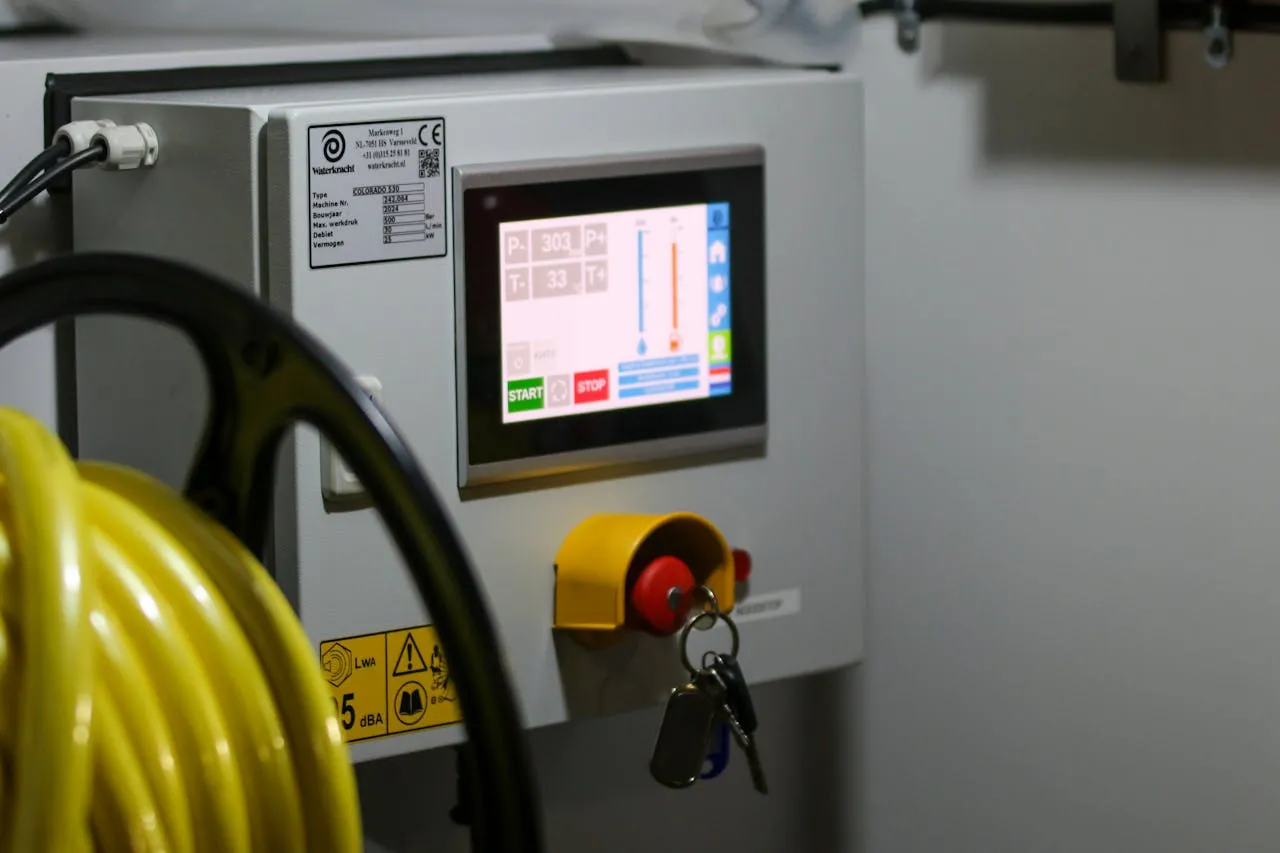
Connect the shop floor to the top floor
Connect the shop floor to the top floor
99% of Australian manufacturers are SMEs, and most are stuck with a patchwork of disconnected systems — an ERP that doesn’t talk to the floor, quality records in a different system, inventory in a spreadsheet, and scheduling on a whiteboard. The technology gap between leaders and laggards is widening, but the solutions are more accessible than ever.
Data in silos, decisions by gut feel
Your ERP knows orders. Your floor knows what’s running. Your quality system knows defects. But nobody has the full picture without hours of manual reconciliation across systems that don’t talk.
Legacy equipment you can’t connect
CNC machines from the 2000s, PLCs with proprietary protocols, and no APIs. Getting data off the equipment and into a useful system feels impossible — but IoT retrofits have made it affordable.
Compliance data you can’t compile
Mandatory climate reporting, Modern Slavery Act thresholds dropping to $50M, WHS audits, ISO recertification — every obligation requires data you’re currently collecting manually or not at all.
Connected systems · Before
Getting a complete picture of production, quality, and inventory means pulling data from 4+ systems and hoping the numbers match.
Connected systems · After
Integrated data from ERP, MES, and quality systems. One view of orders, production status, quality, and delivery. Decisions made in minutes, not days.
Equipment connectivity · Before
Your machines run in isolation. You have no idea how they’re actually performing until someone walks the floor or reads the logbook.
Equipment connectivity · After
IoT sensors and retrofit solutions pull data from legacy equipment. Real-time machine status, cycle times, and utilisation visible from anywhere.
Compliance and reporting · Before
Every audit, every compliance submission, every regulatory report is a manual scramble. It takes weeks and you’re never fully confident in the data.
Compliance and reporting · After
Automated data collection feeds directly into reporting frameworks. Emissions tracking, quality audits, and safety reporting generated from operational data, not separate spreadsheets.
The numbers don't lie
These aren’t projections. They’re documented results from manufacturers who’ve made the shift.
10–25%
OEE improvement from real-time monitoring
Industry benchmark
30–50%
Reduction in unplanned downtime with predictive maintenance
Deloitte / DOE
25%
Of production costs consumed by rework in typical plants
Industry research
37%
Less downtime for manufacturers with proper corrective action
Industry benchmark
10:1
Typical ROI from predictive maintenance programs
U.S. DOE
70%
Of manufacturing digital transformations fail without proper implementation
Industry benchmark
What working with us looks like
We don't hand you a report and walk away. We work alongside you to change how your business runs.
Step 1
We learn your operation
We spend time on your shop floor, with your operators, your supervisors, and your data. We look at how work flows from order to dispatch — where downtime hides, where quality drops, and where systems don’t connect.
Step 2
We show you the picture
You get a clear, straight-talking view of where your operation is strong and where it’s bleeding time, yield, and margin. No jargon, no 200-page report. Just an honest assessment with real numbers.
Step 3
We build the fix — with you
We set up the right systems and processes for your plant, your people, and your product. We make sure your operators and supervisors actually use them. We stay until the new way of working sticks.
Step 4
You run it from here
The goal is a plant that runs properly without us. Better OEE, fewer quality escapes, less firefighting. You manage by dashboard, not by walking the floor putting out fires.
Let’s talk about what’s actually costing you production
No consultancy theatre. No death-by-PowerPoint. We’ll spend time on your shop floor — at the machines, with your operators, in your planning meetings. You’ll get a clear, honest picture of where your operation is bleeding time, quality, and margin, and a practical plan to fix it. 30 minutes. No pitch. Just a straight conversation.
Book a Conversationinfo@xpeditepartners.com.au