
Utilities Industry
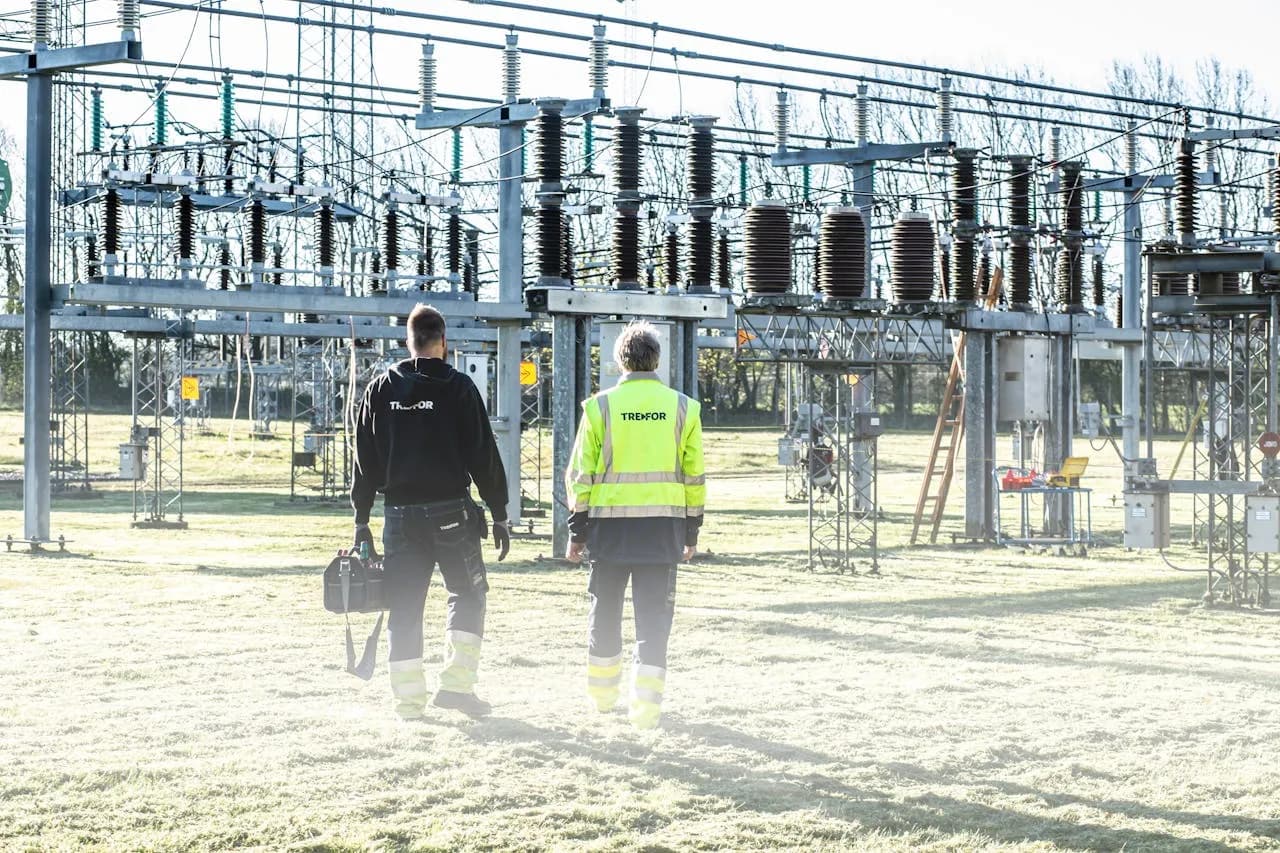
Pipes from the 1960s. Power lines at end of life. And not enough people to fix either.
Australia’s electricity, water, and gas utilities are all hitting the same wall — aging infrastructure, tighter regulation, a workforce walking out the door, and systems that don’t talk to each other. Whether you’re replacing water mains or upgrading substations, we help you fix the delivery and operating systems so you can actually keep up.
300,000
Infrastructure worker shortfall by 2027
Infrastructure Australia
$87B
Energy network investment needed by 2050
AEMO ISP
30%+
Water lost to leaks in some networks
Bureau of Meteorology
20–22%
Capital spend increase proposed by networks
IEEFA
Sound familiar?
If you’re running a utility or network operation in Australia right now, you’re probably nodding at most of these.
Your most experienced operators are retiring — and their knowledge of the network, the pipes, and the workarounds is walking out with them
Water mains are bursting, power assets are failing, and the replacement backlog grows faster than your crews can work through it
Your SCADA, GIS, asset management, and work management systems all live in separate worlds — and nobody has the full picture
Capital works programs keep slipping — and the regulator wants to know why you’re underspending your allowance
Safety and compliance reporting takes whole teams — from electrical safety to water quality to environmental monitoring
Field crews spend more time on paperwork, travel, and chasing information than actually maintaining infrastructure
You’ve invested in new systems but half the field crews are still running off paper forms and local knowledge
Regulatory submissions across multiple agencies — AER, state safety, water quality, environmental — consume months of effort every cycle
It’s not the pipes or the poles. It’s how the business runs around them.
Most utilities have invested in network assets and field technology. But the systems connecting them — how work flows from a burst main or a network fault through to dispatch, completion, and reporting — are held together with spreadsheets, emails, and tribal knowledge. When your SCADA, GIS, asset management, work management, and finance systems don’t talk to each other, you’re making million-dollar capital decisions on incomplete information. Whether it’s a water network losing 30% to leaks or a power network with a growing maintenance backlog, the technology to fix this exists. But 70% of digital transformations in utilities fail because nobody changes how the organisation actually works around the new tools. That’s the gap we close.
Get ahead of your aging infrastructure before it gets ahead of you
Get ahead of your aging infrastructure before it gets ahead of you
Water mains from the 1960s. Power lines at end of life. Treatment plants running beyond design capacity. Across electricity and water, Australian utilities are proposing 20–22% capital spend increases just to keep up with replacement. But throwing money at assets without the right systems means you’re replacing things too early, too late, or in the wrong order.
Replacing assets on age, not condition
Without condition monitoring, you’re either replacing pipes and poles too early (wasting capital) or too late (after they’ve already burst or failed). Predictive maintenance reduces unplanned failures by 70–75% and cuts maintenance costs 25–30%.
No single view of asset health
Your asset register lives in one system, maintenance history in another, and condition data — pressure sensors, leak detection, transformer monitoring — in a third. Getting a complete picture means chasing data across platforms.
Reactive maintenance eating your budget
Every burst main or emergency callout costs 4–5x more than planned work and displaces scheduled maintenance. Some water networks lose over 30% of supply to leaks. The backlog just keeps growing.
Asset decisions · Before
You replace pipes and poles based on age and gut feel. Some fail before replacement. Others get swapped out with years of life left.
Asset decisions · After
Condition-based data drives every replacement decision. You spend capital where it matters most — whether that’s a critical water main or an aging feeder line.
Maintenance approach · Before
Your team spends most of its time reacting to burst mains, equipment failures, and emergency callouts. Planned work keeps getting bumped.
Maintenance approach · After
Predictive analytics flag problems before they become failures. Leak detection catches losses early. Maintenance shifts from reactive to planned across the whole network.
Asset visibility · Before
Getting a complete picture of network health means pulling data from 4+ systems and reconciling it manually. Nobody fully trusts the numbers.
Asset visibility · After
One integrated view — pipes, valves, transformers, treatment assets — showing condition, maintenance history, and risk. Capital decisions made with confidence, not guesswork.

Deliver your capital program without the cost blowouts
Deliver your capital program without the cost blowouts
Whether it’s transmission upgrades, water treatment plant expansions, or pipe renewal programs — the pressure to deliver on time and on budget has never been higher. Regulators are watching. Customers are paying. Material costs have jumped 30%+ since contracts were signed. And the workforce to deliver it all is in short supply.
Programs slipping quarter after quarter
Capital works programs consistently underspend against allowances — not because the money isn’t there, but because delivery capacity can’t keep up. Regulators notice, and it affects future determinations.
Contractors with no common systems
Multiple delivery partners, multiple reporting formats, no single view of program progress. The gaps between contracts are where the real risks and cost overruns live.
Project costs discovered too late
Cost overruns are identified in execution, long after scope and estimates were locked in. By the time you see the problem, the money is already spent.
Program delivery · Before
You track capital programs in spreadsheets. Progress reporting depends on which contractor sends their update first. Underspend surprises hit at year-end.
Program delivery · After
One program view across all contractors and work streams. Progress, spend, and risk visible in real time. You deliver against your regulatory allowance consistently.
Cost control · Before
You find out a project is over budget weeks after the overspend started. Variation claims pile up and there’s no audit trail for scope changes.
Cost control · After
Real-time cost tracking against baseline. Variations require digital approval with full history. You intervene while there’s still room to course-correct.
Contractor management · Before
Each delivery partner reports differently. Integrating across contracts takes days of manual effort every reporting cycle.
Contractor management · After
Common reporting framework, standardised milestones, one source of truth. You manage the program, not the spreadsheets.

Do more with the people you’ve got
Do more with the people you’ve got — because you can’t find more
Australia faces a shortfall of 300,000 infrastructure workers by 2027. Electricians, water treatment operators, network technicians, plumbers — every trade is stretched. You’re not going to hire your way out of this. The utilities that win will be the ones that get more from every field crew, every planner, and every hour on the network.
Decades of knowledge walking out the door
Your most experienced operators — the ones who know every valve, every feeder, every quirk in the network — are retiring. Their knowledge lives in their heads, not in any system.
Field crews drowning in admin
Crews spend hours on safety paperwork, water quality sampling forms, job close-outs, and compliance logs. That’s wrench time you’re not getting back. Digital field solutions reclaim 1–2 hours per crew per day.
The trade pipeline can’t keep up
Australia needs 20,500 apprentice electricians commencing annually — 40% higher than recent averages. Water and wastewater operators face similar shortages. There’s even a shortage of trainers to train them.
Knowledge capture · Before
Critical network knowledge lives in the heads of your most experienced people. When they retire, it goes with them.
Knowledge capture · After
Digital SOPs, structured handover processes, and knowledge management systems. The network’s history and quirks are captured in the system, not lost at retirement.
Field productivity · Before
Crews spend 30–40% of their day on paperwork, travel coordination, and chasing information. Actual wrench time is lower than it should be.
Field productivity · After
Mobile work management, digital safety forms, and real-time job dispatch. Crews get the right information before they leave the depot and close jobs from the field.
Workforce development · Before
New starters take years to be effective. Training is ad-hoc and depends on whoever happens to be available to mentor them.
Workforce development · After
Structured competency frameworks, digital training records, and clear progression pathways. People get productive faster and you can prove their competency to regulators.
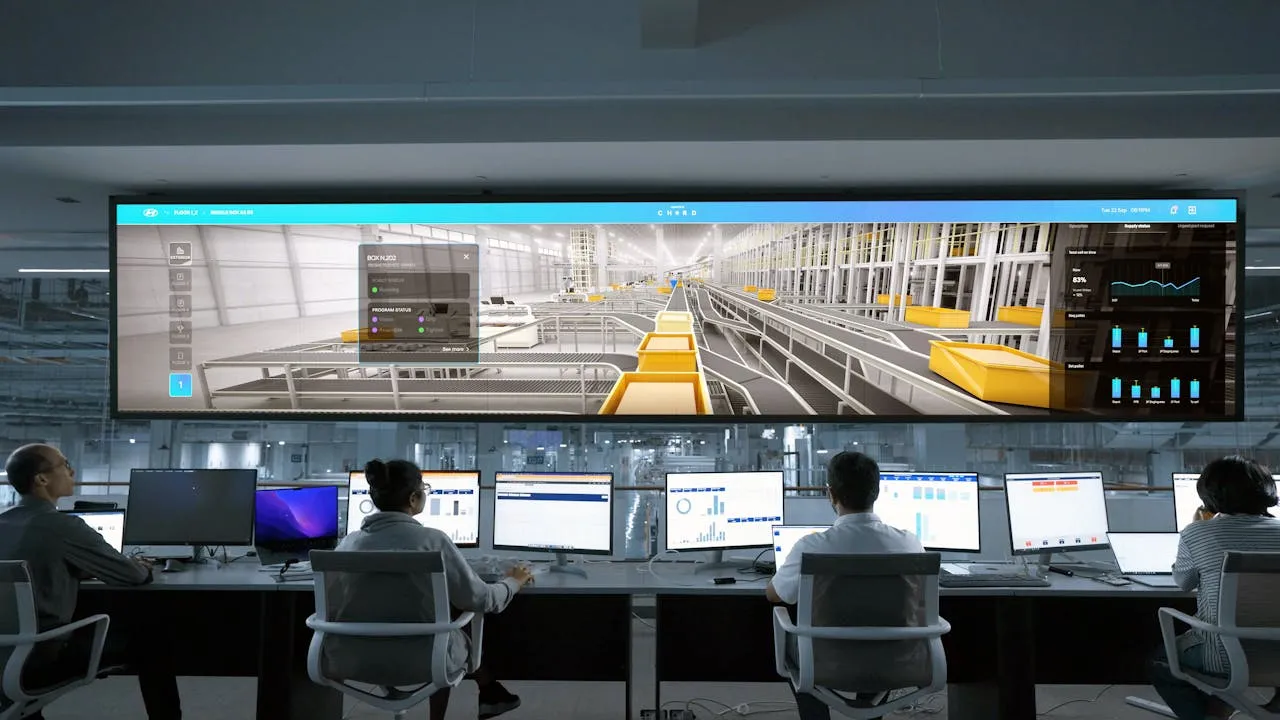
Make your systems actually work together
Make your systems actually work together
The average utility runs dozens of disconnected platforms — SCADA, telemetry, GIS, asset management, work management, water quality monitoring, outage management, finance. Each one works on its own. Together, they’re a mess. And the gap between what technology can do and what most mid-tier utilities actually use is enormous.
Data in silos, decisions in the dark
Your SCADA knows network state. Your GIS knows asset location. Your telemetry knows pressure and flow. Your work management knows job status. But nobody has the full picture without hours of manual reconciliation.
Digital projects that don’t deliver
You’ve invested in platforms that promised transformation. Twelve months later, adoption is patchy and the old spreadsheets are still running alongside. 70% of utility digital transformations fail.
OT/IT convergence is a minefield
Connecting operational technology to IT systems — whether it’s smart grid analytics or real-time water quality monitoring — is essential. But security concerns, legacy protocols, and organisational silos make it one of the hardest problems in the sector.
Connected systems · Before
Getting a complete operational picture means pulling data from 5+ systems and reconciling formats. By the time you have the answer, the situation has changed.
Connected systems · After
Integrated data architecture where SCADA, telemetry, GIS, asset management, and work management speak the same language. One source of truth for operations and planning.
Digital adoption · Before
You bought the system. The vendor installed it. Six months later, adoption is patchy and the old ways persist alongside the new platform.
Digital adoption · After
Technology implemented around how your people actually work. Change management built in from day one. Adoption sticks because the system makes their job easier, not harder.
Regulatory reporting · Before
Every regulatory submission is a months-long manual exercise. Teams scramble to pull data, reconcile numbers, and compile reports under deadline pressure.
Regulatory reporting · After
Automated data collection feeds directly into reporting frameworks. Submissions are faster, more accurate, and auditable. Your team focuses on insights, not data entry.
The numbers don't lie
These aren’t projections. They’re documented results from utilities that have made the shift.
70–75%
Reduction in unplanned asset failures with predictive maintenance
DOE / Deloitte
25–30%
Lower maintenance costs with condition-based approach
McKinsey
30%+
Non-revenue water reduced with smart leak detection and pressure management
Bureau of Meteorology
20–40%
Asset life extension with condition monitoring
Industry benchmark
10:1
Average ROI from predictive maintenance programs
U.S. DOE
70%
Of utility digital transformations fail without proper implementation
Industry benchmark
What working with us looks like
We don't hand you a report and walk away. We work alongside you to change how your business runs.
Step 1
We learn your operation
We spend time in your control room, with your field crews, and in your planning offices. We look at how work flows from fault detection to completion — where decisions get delayed, where data gets lost, and where systems don’t connect.
Step 2
We show you the picture
You get a clear, straight-talking view of where your operation is strong and where it’s bleeding time, reliability, and money. No jargon, no 200-slide deck. Just an honest assessment with real numbers.
Step 3
We build the fix — with you
We set up the right systems and processes for your network and your people. We make sure your field crews and planners actually use them. We stay until the new way of working sticks — not just until the vendor’s gone.
Step 4
You run it from here
The goal is a utility that runs properly without us. Better asset visibility, fewer unplanned outages, less firefighting. You manage by dashboard, not by radio and reactive dispatch.
Let’s talk about what’s actually slowing your operation down
No consultancy theatre. No death-by-PowerPoint. We’ll spend time with your operation — in the control room, at the treatment plant, with your field crews. You’ll get a clear, honest picture of where your systems are costing you reliability, money, and time, and a practical plan to fix it. 30 minutes. No pitch. Just a straight conversation.
Book a Conversationinfo@xpeditepartners.com.au